Wastewater Wednesday (a day late) - 2/27/25
Apologies for being late with this week's wastewater update. Yesterday was full of (good! community-building!) mayhem and so I ran out of time. But let's get to it. Here's your Wastewater Wednesday update on Thursday because the 💩 doesn't lie!
COVID
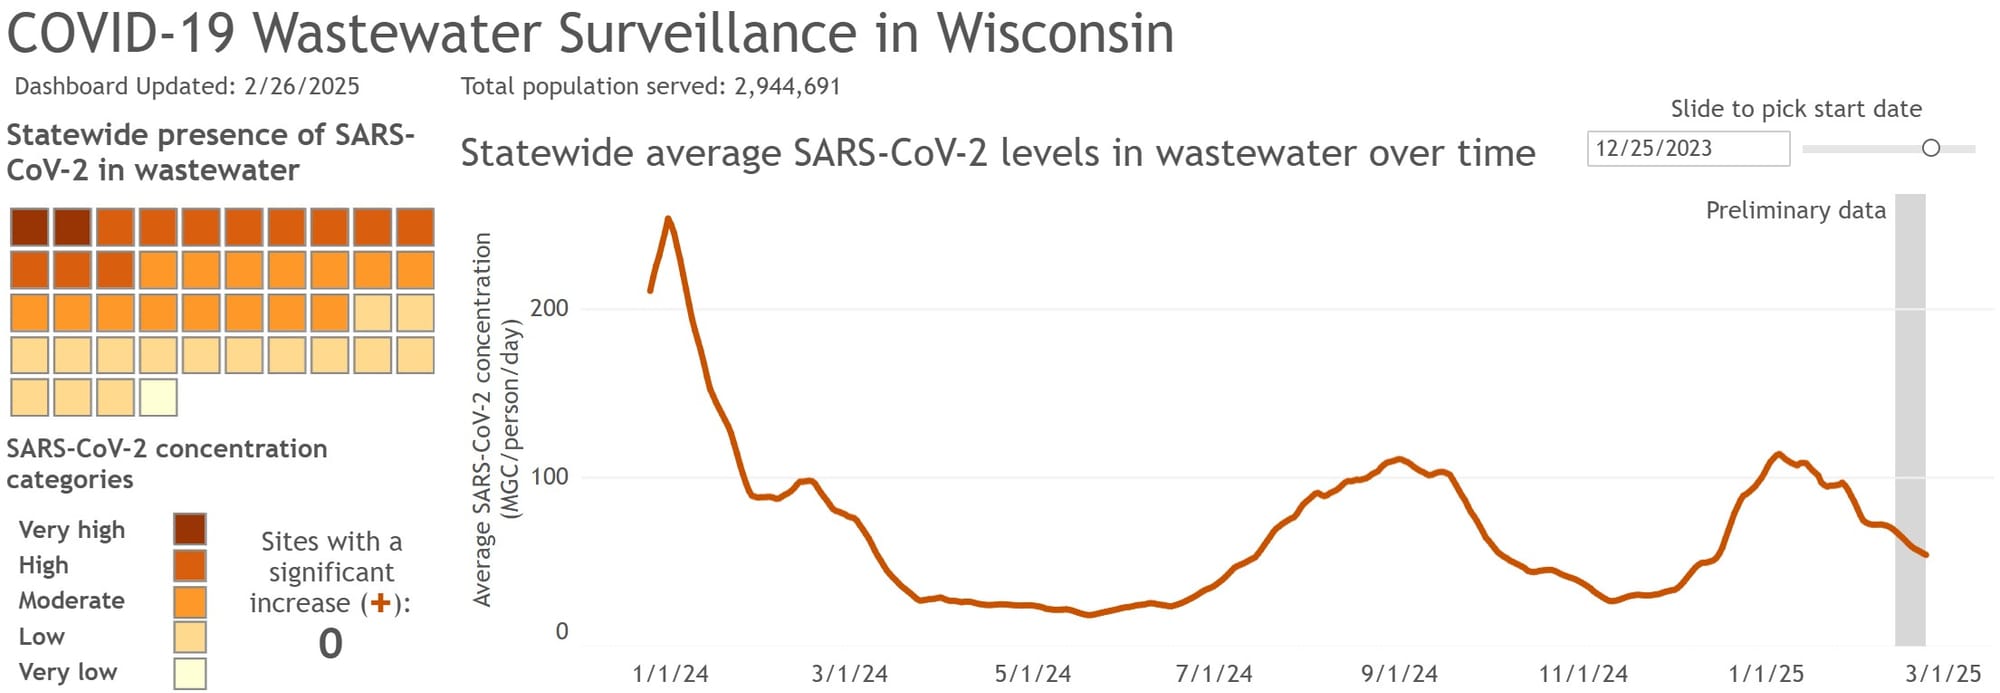
Let's start with the good news - COVID levels in the wastewater are continuing to drop! After looking like we might have been entering a high plateau last week, this is a welcome change of events!
This does not mean that levels are dropping evenly in all sewersheds, however. A few (such as Milwaukee Jones Island and Walworth County) are still showing increases, albeit shallow ones.
But we're not at the mercy of the data - our actions shape what this graph will look like in the future, and we CAN continue to drive those levels lower if we mask up, clean the air, and stay home when we're sick.
National Data
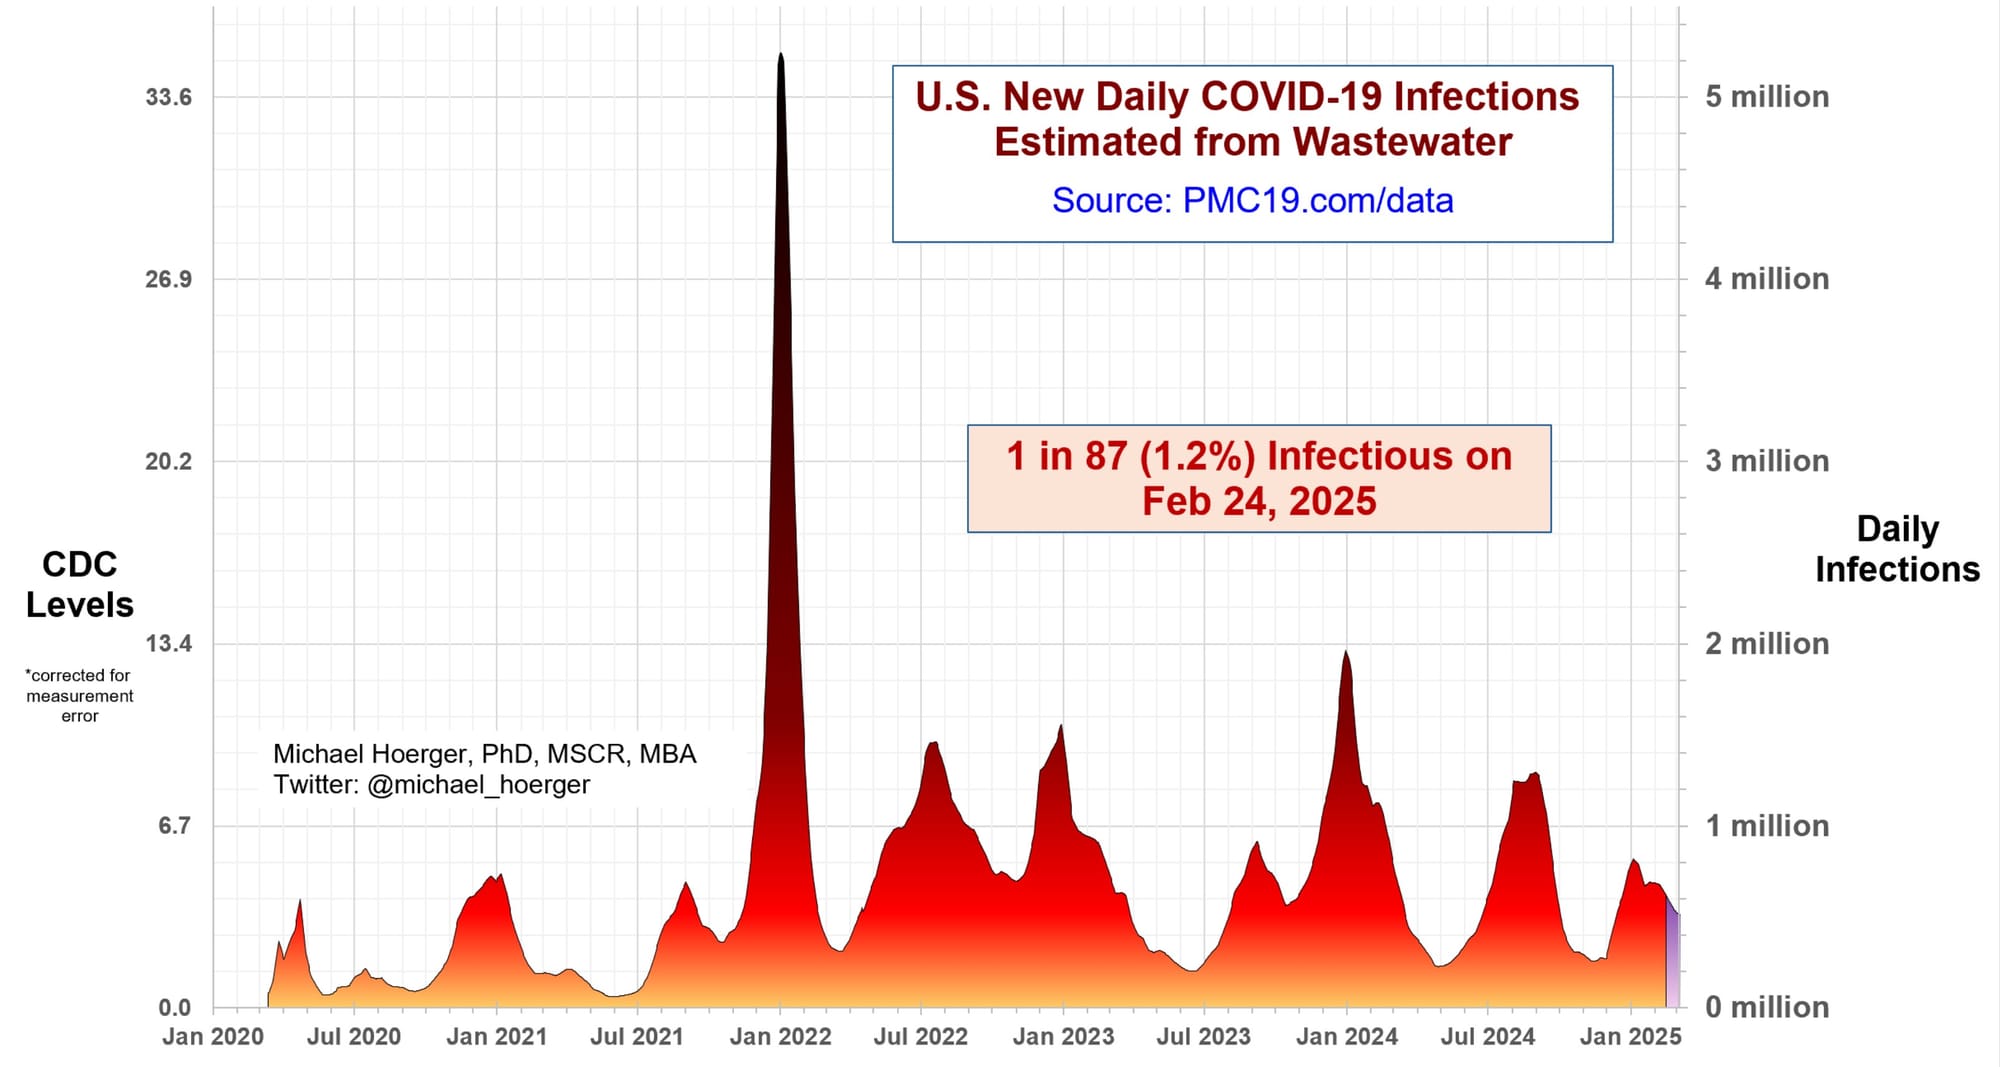
Zooming out now to the national level, we also see a welcome decline in the SARS-CoV-2 wastewater concentration. However, in absolute terms, there is still a lot of COVID out there. 1 in 87 people is actively infectious, which means that if you're on a plane, there's almost certainly someone contagious on there with you. If you're in a classroom of 30 students, there's a nearly 30% chance that someone is infectious.
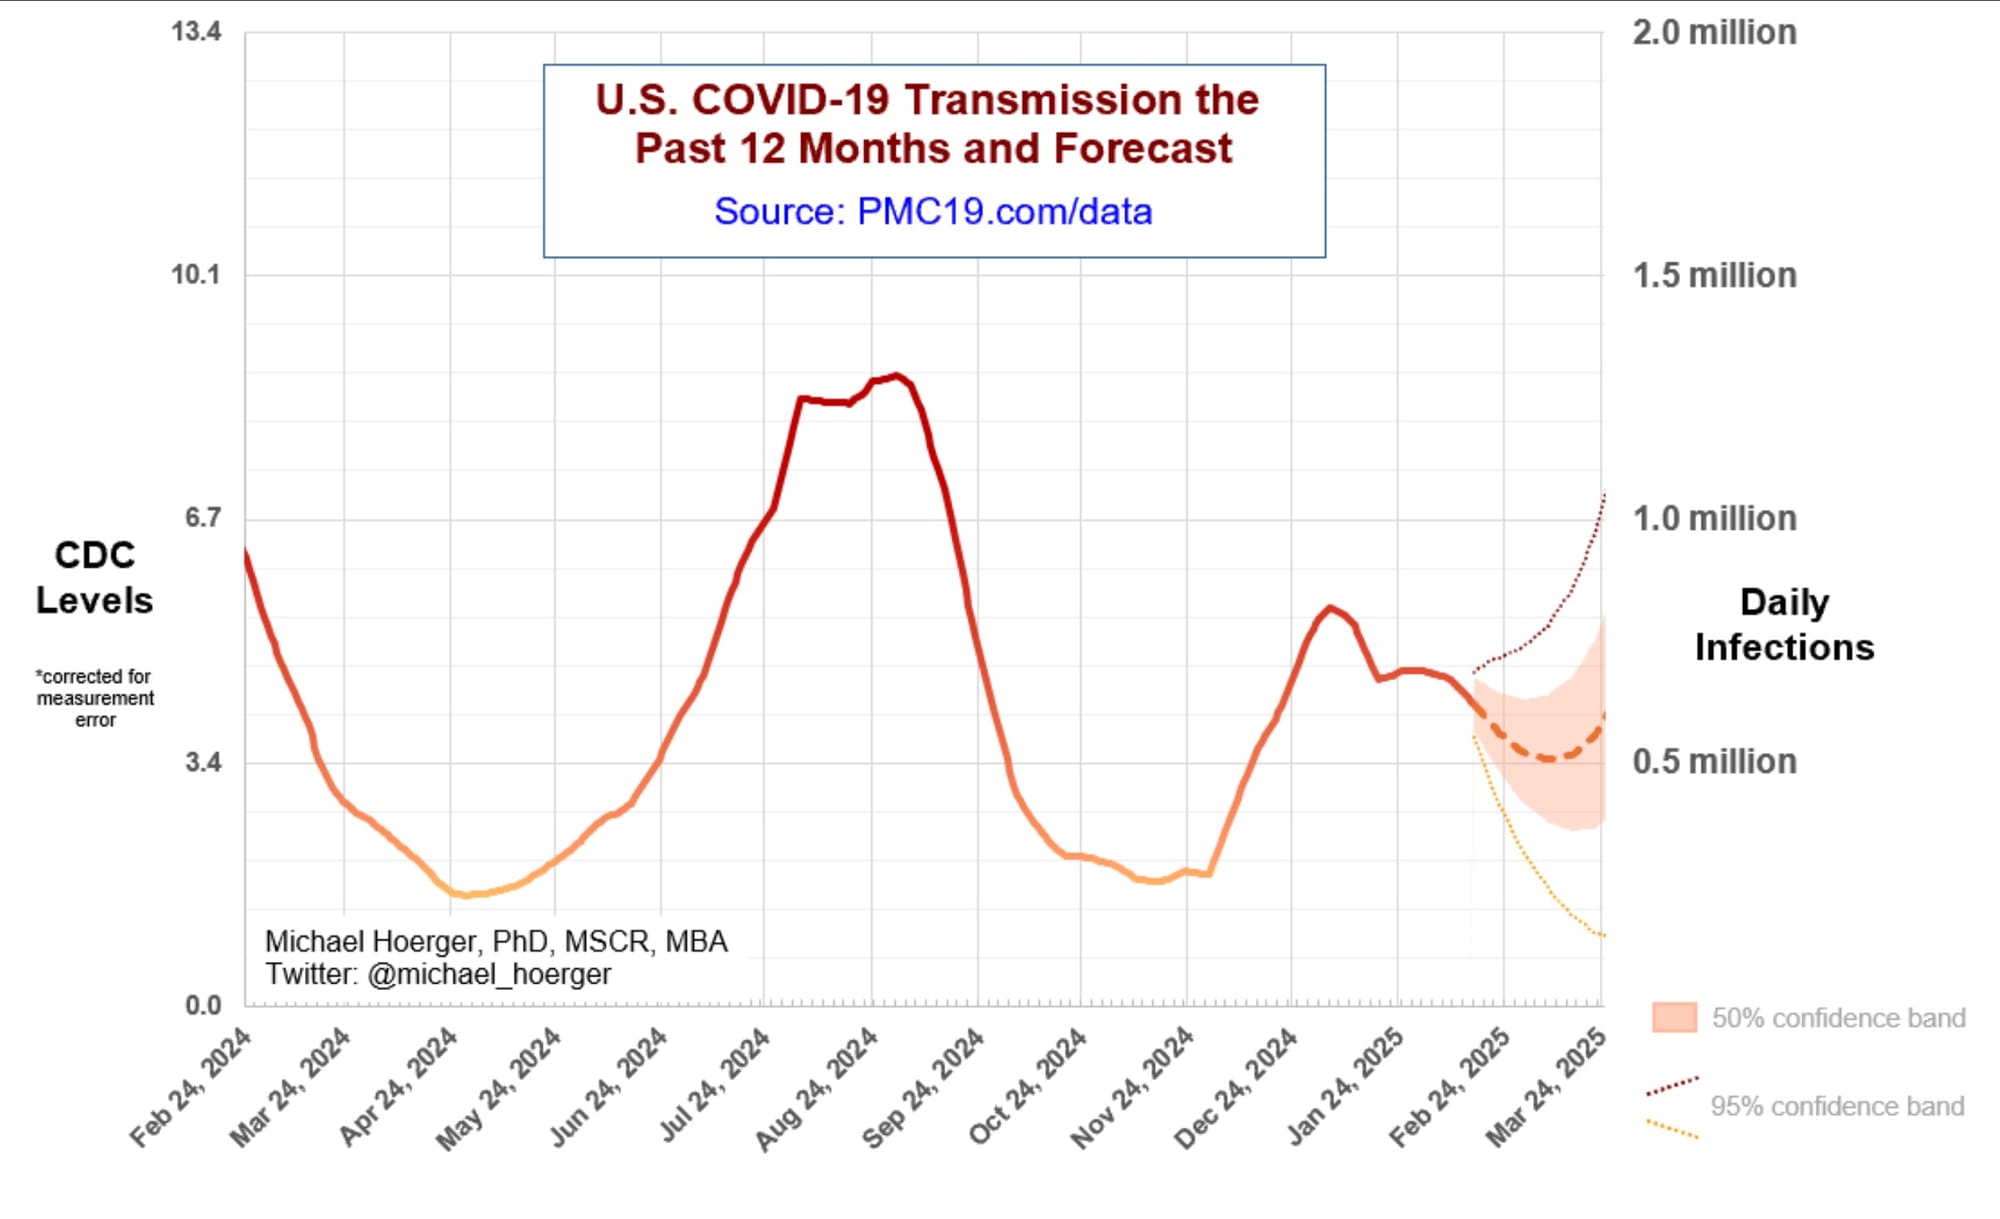
Looking ahead, I do not like what the forecast models are showing us. If this forecast holds, transmission is going to bottom out within the next few weeks, before trending upwards again right around when spring break starts hitting. I'm holding out hope that it will be a small bump before declining into the late spring/early summer, but time will tell.
Influenza
Meanwhile, checking out the influenza data, it looks like we may have crossed the peak of our absolutely massive Flu A wave; however, levels are still triple what they were last year, and it's possible that we may see a resurgence or a Flu B wave as we head into March (as happened last year).
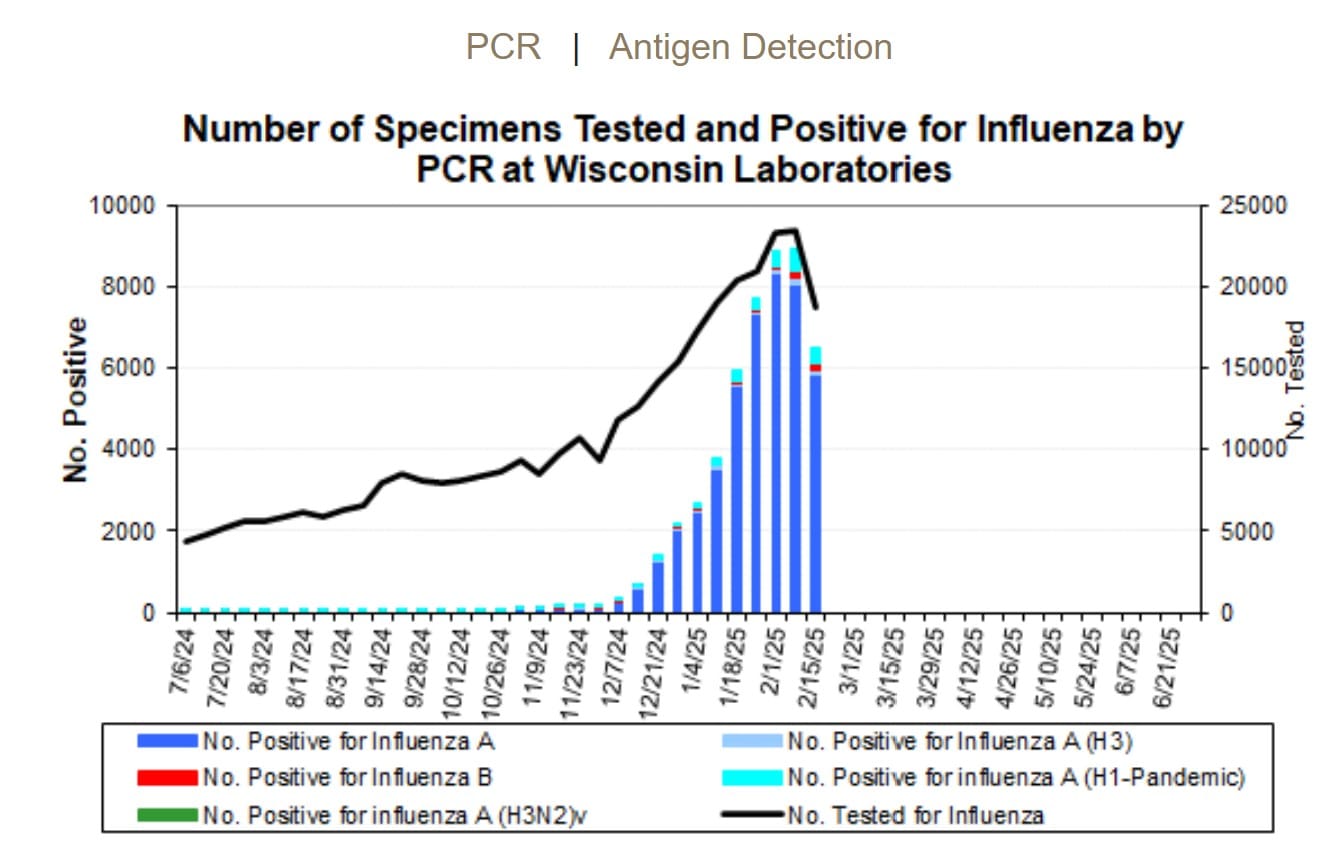
Remember - our actions drive the data. It's not too late to get your flu shot, and wearing a well-fitting respirator will absolutely give you protection against the flu as well as COVID!
Stay safe out there, friends!