Wastewater Wednesday - 3/12/25
Sorry about missing last week. Everything going on lately...well...it's just a lot. But I'm back at it today, and I promise I also have about five other posts on various topics in various stages of drafting that will be coming up soon! But let's get to it and see how things are going, 5 years out from the start of the pandemic.
COVID
The 💩 doesn't lie - it's been 5 years but COVID is still with us, and it's still a pandemic. The good news for this week, though, is that we're officially entering our spring lull:
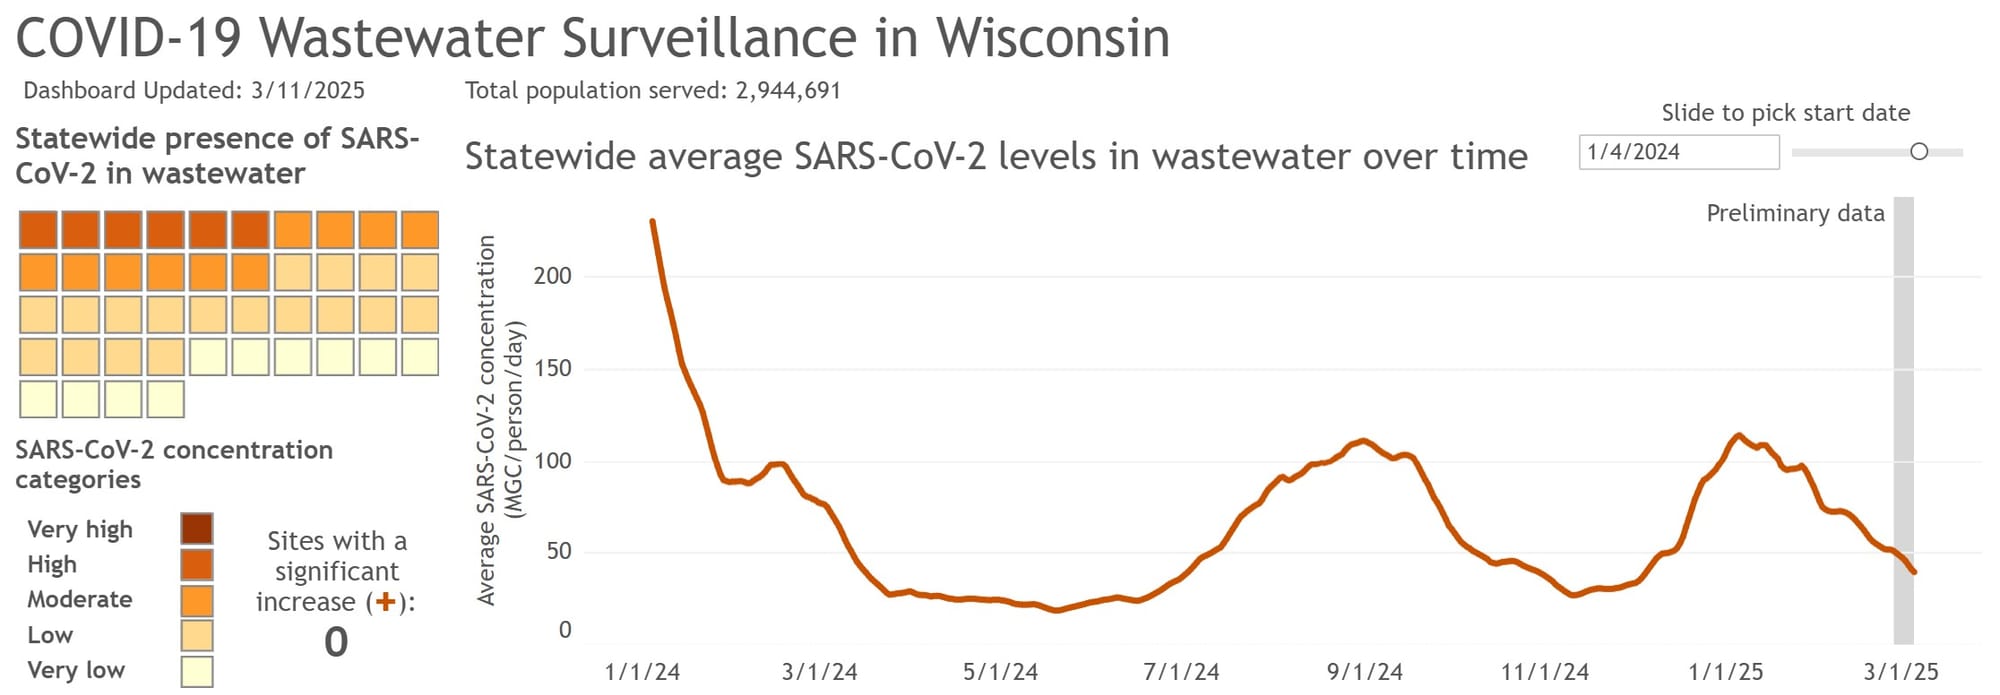
March - June is has typically been the time of lowest transmission, and is the best time to get unavoidable risky appointments like the dentist taken care of. I'm glad to see that the decline is continuing - for a while it had been looking like we were going to get stuck on a high plateau, but luckily that does not seem to be the case.
What is unfortunate, though, is that if you zoom out to the whole pandemic, our lulls are not dropping as low as they used to.
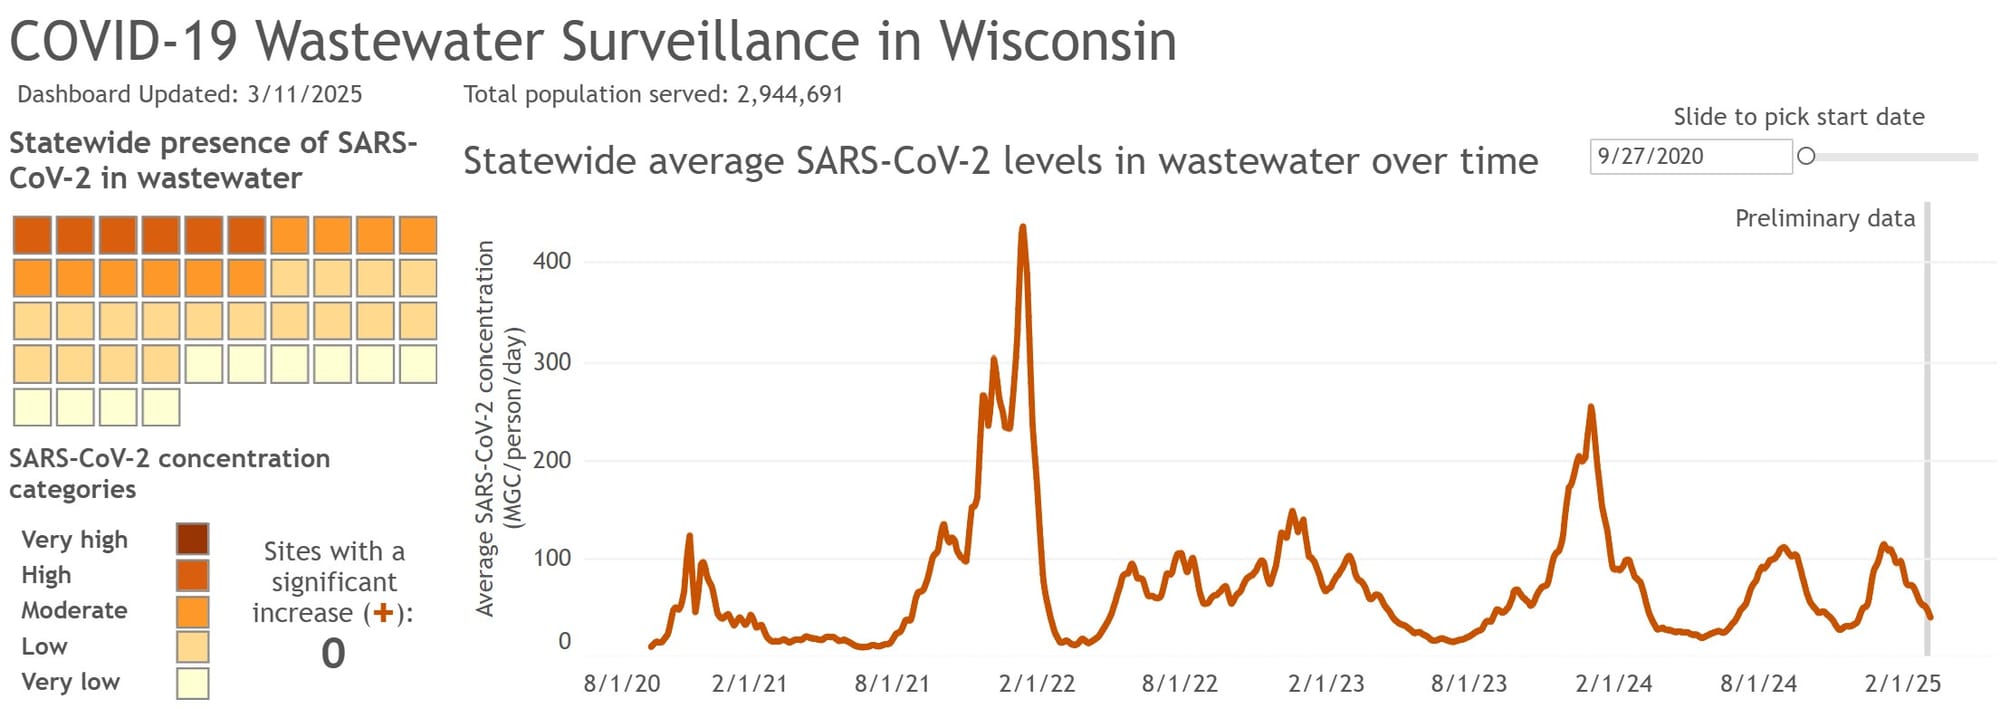
It's hard to see, but if you go to the DHS website and explore the graph, you'll see that the first, long lull in 2021 hovered around 15-19MGC/person/day, with the lowest point being just 9MGC/person/day. The next lull, the short one after the Omicron wave, is around 16-17MGC/person/day. The summer 2023 lull is also around 16-17MGC/person/day. But then the lull in spring of 2024 is around 21-24MGC/person/day, and the dip we had in November 2024 never got below 26MGC/person/day.
Currently, we are at 39.2MGC/person/day. I hope that it continues to drop, but what this shows is that COVID is always circulating. It has never gone away, and even when there's less of it around, what actually qualifies as "less" is increasing.
Influenza
Our massive flu wave is also continuing to decrease, though we are STILL above last year's peak. I'm running out of time, so I'm not going to do a deep dive on the flu today, but know that you can check the data any time on the Wisconsin State Laboratory of Hygiene's website!
Stay safe out there, friends! COVID and flu aren't the only diseases we have to worry about these days, but a mask will protect you against almost all of them!