Wastewater Wednesday - 2/19/25
Time for another Wastewater Wednesday because the 💩 doesn't lie!
COVID
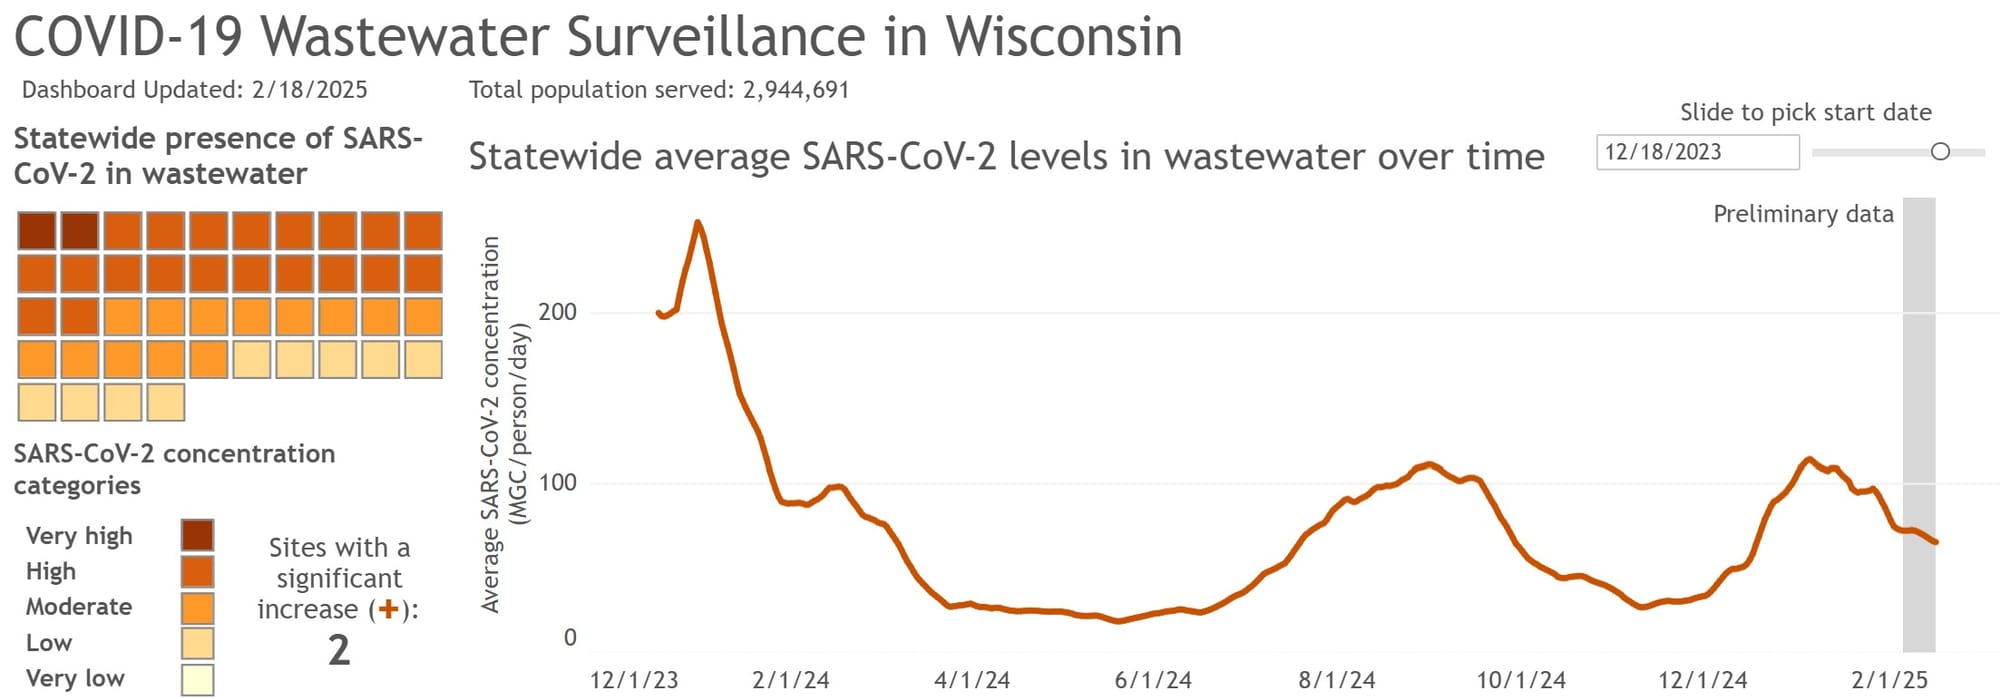
Statewide, we continue to see a decline in the amount of SARS-CoV-2 being detected in the wastewater, but unfortunately, the rate of decline already appears to have slowed. Compare this to the previous, late summer/early fall wave which declined steeply for a longer time before leveling out at what was still quite a high absolute level of transmission.
If we zoom out to look at the pandemic as a whole, we can see that this is part of a worrying pattern: each wave peaks and then declines, but if you compare the valleys, the "lulls" are much higher since Omicron and its descendants took over, and nationally, the current wave seems to have leveled off at a sustained high rate of transmission.
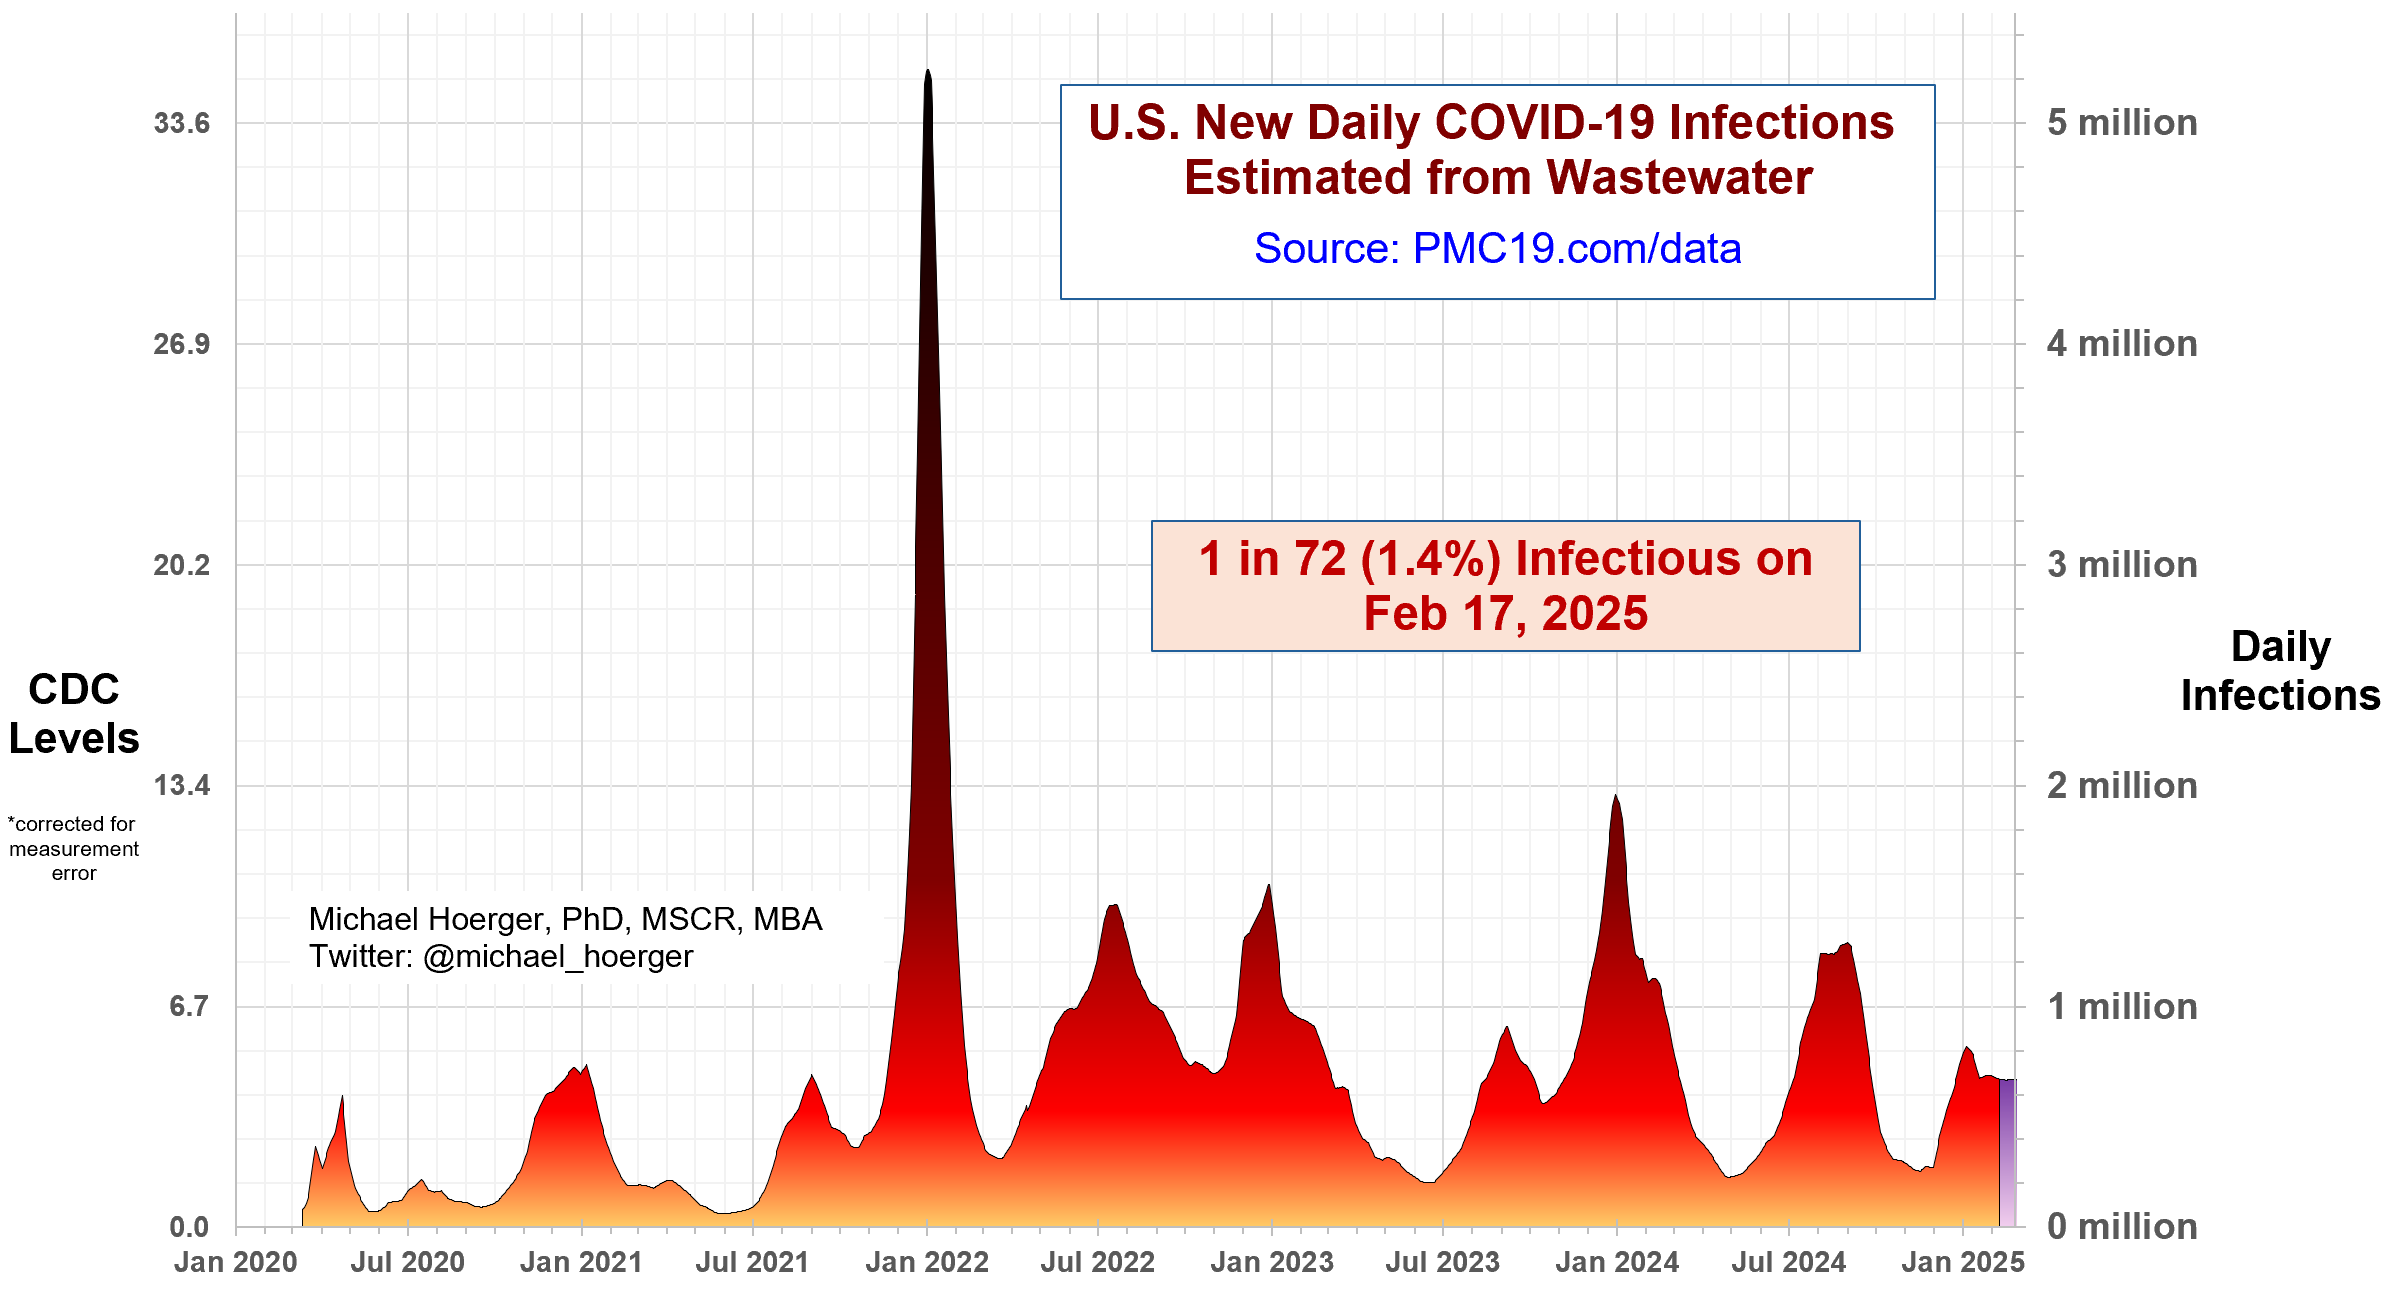
What this means is that unlike influenza, which has definite seasons (ie there's lots of flu in the winter and basically none in the summer), COVID never goes away. It is ALWAYS circulating. The lulls are less risky than the peaks, but even in the lulls it's still out there.
Local COVID Updates
A quick update from last week first - that high point from Milwaukee South Shore does seem to have been an anomaly. The next data point aligns with the overall trendline, which is mostly level. (Not ideal, since we'd obviously prefer to see a decline, but definitely better than a new spike showing up!)
The other locality I want to highlight this week is Janesville:
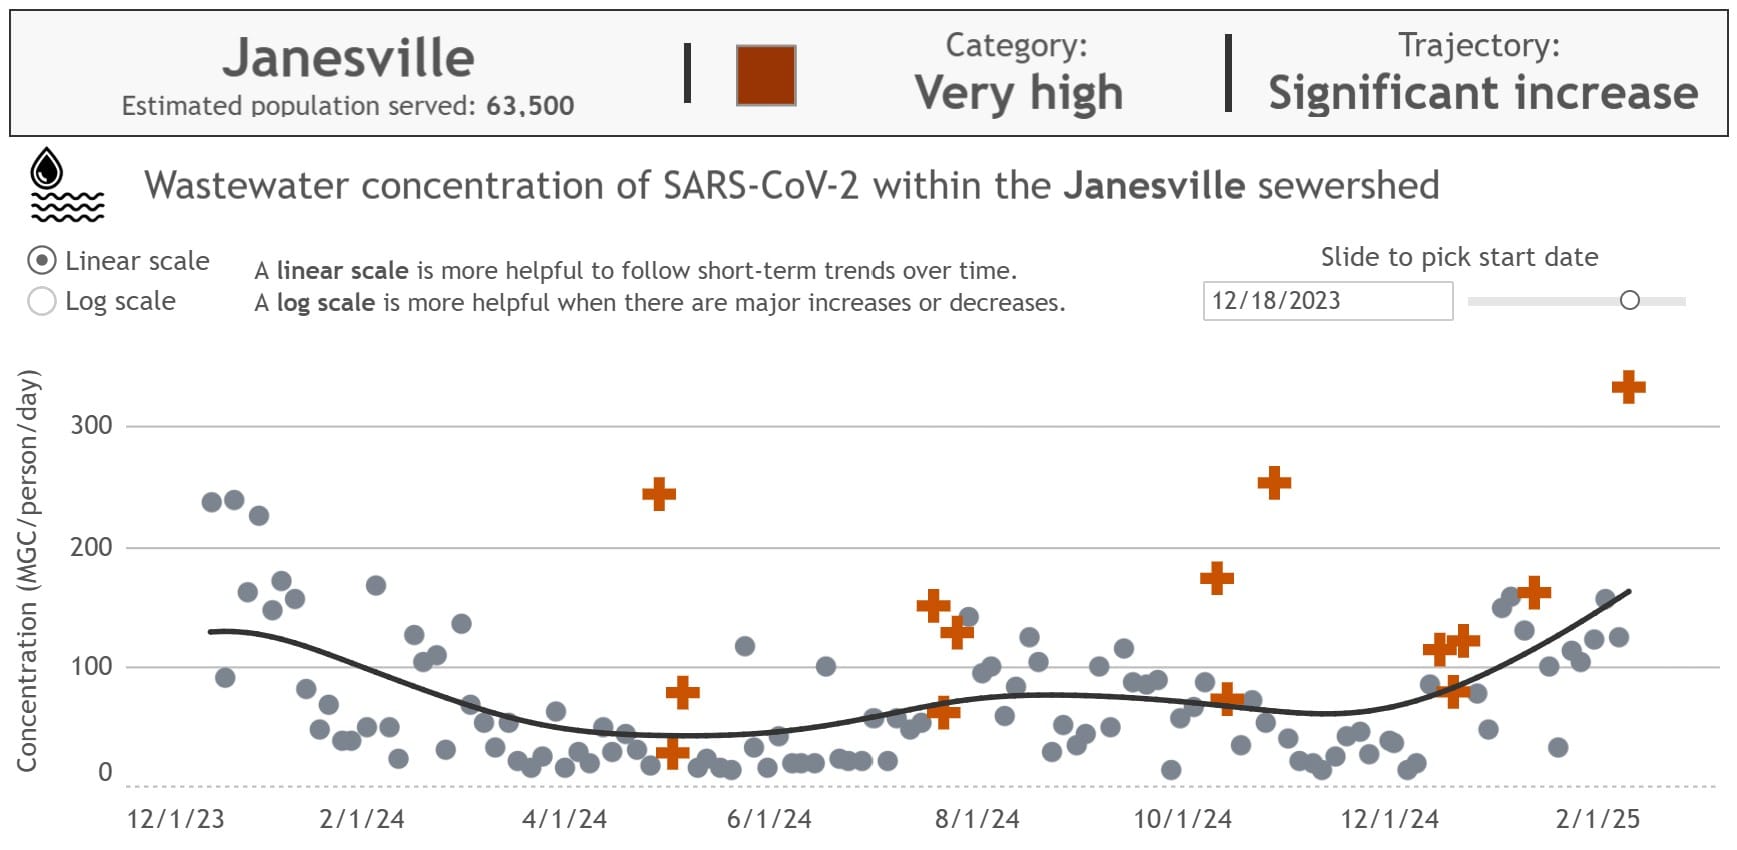
The trendline was already showing exponential growth, but the sudden increase to 332.3 is not great to say the least! Please protect yourself and your loved ones, and make sure you're masking up in a well-fitting respirator every time you share air!