Acceleration
Two posts from me in one week...a reflection of how quickly things are worsening.
If you haven't been following what's been going on, here's the quick and dirty summary from Dr. Mike Hoerger:
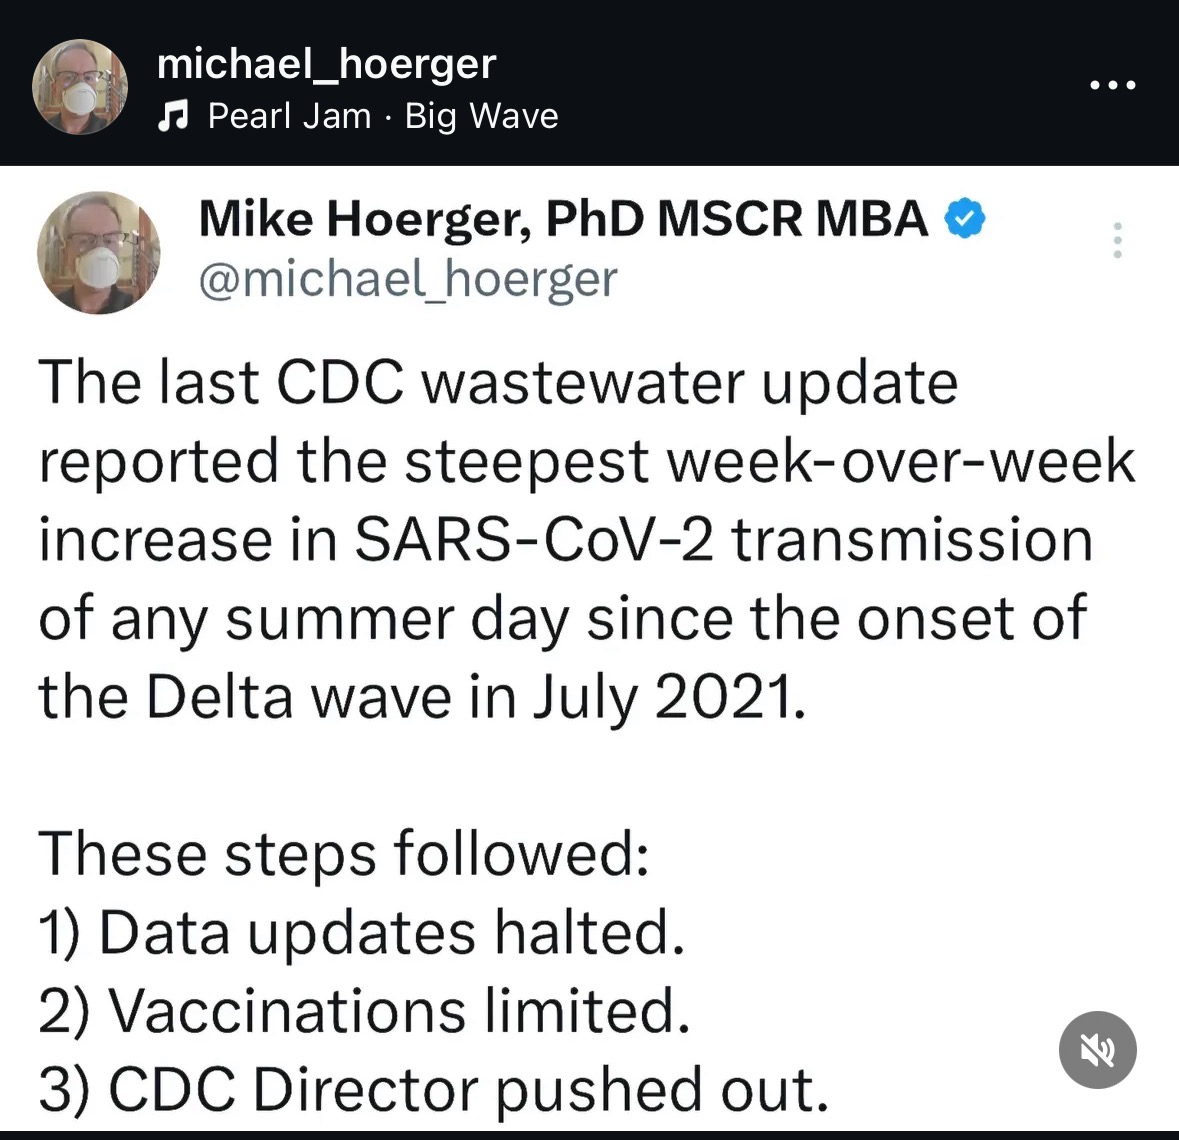
That's right, the government decided to black out the data, limit vaccine access, and fire the CDC director right as the 11th wave of this pandemic is picking up steam.
The new guy in charge at the CDC has no degree in science or medicine, shilled ivermectin in the early days of the pandemic, is a fan of paid organ donation (he said, and I quote, "There are plenty of healthy spare kidneys walking around, unused."), and is buddies with billionaire investor Peter Thiel (the Palantir guy, who is, among other things, apparently funding a private facility for enriching uranium).
I do not have enough words for how bad this is.
Meanwhile, COVID is also accelerating. This wave is hitting hard and fast. The Public Coughing Index (aka my wholly subjective measure of how many people I hear having nasty coughs in public) went from basically zero last week to 😬😬😬 today.
Side note: If your toddler has a nasty, uncontrolled, wet cough, don't be bringing them out in public to cough all over other people's toddlers! Stay tf home!!!
Wastewater Data
The number of people I know locally with COVID is also increasing, which is another sure sign that this wave is upon us. But you don't have to take my word for it. Let's take a look at the wastewater data, which, in another sign of this rising COVID wave, posted updates yesterday AND today:
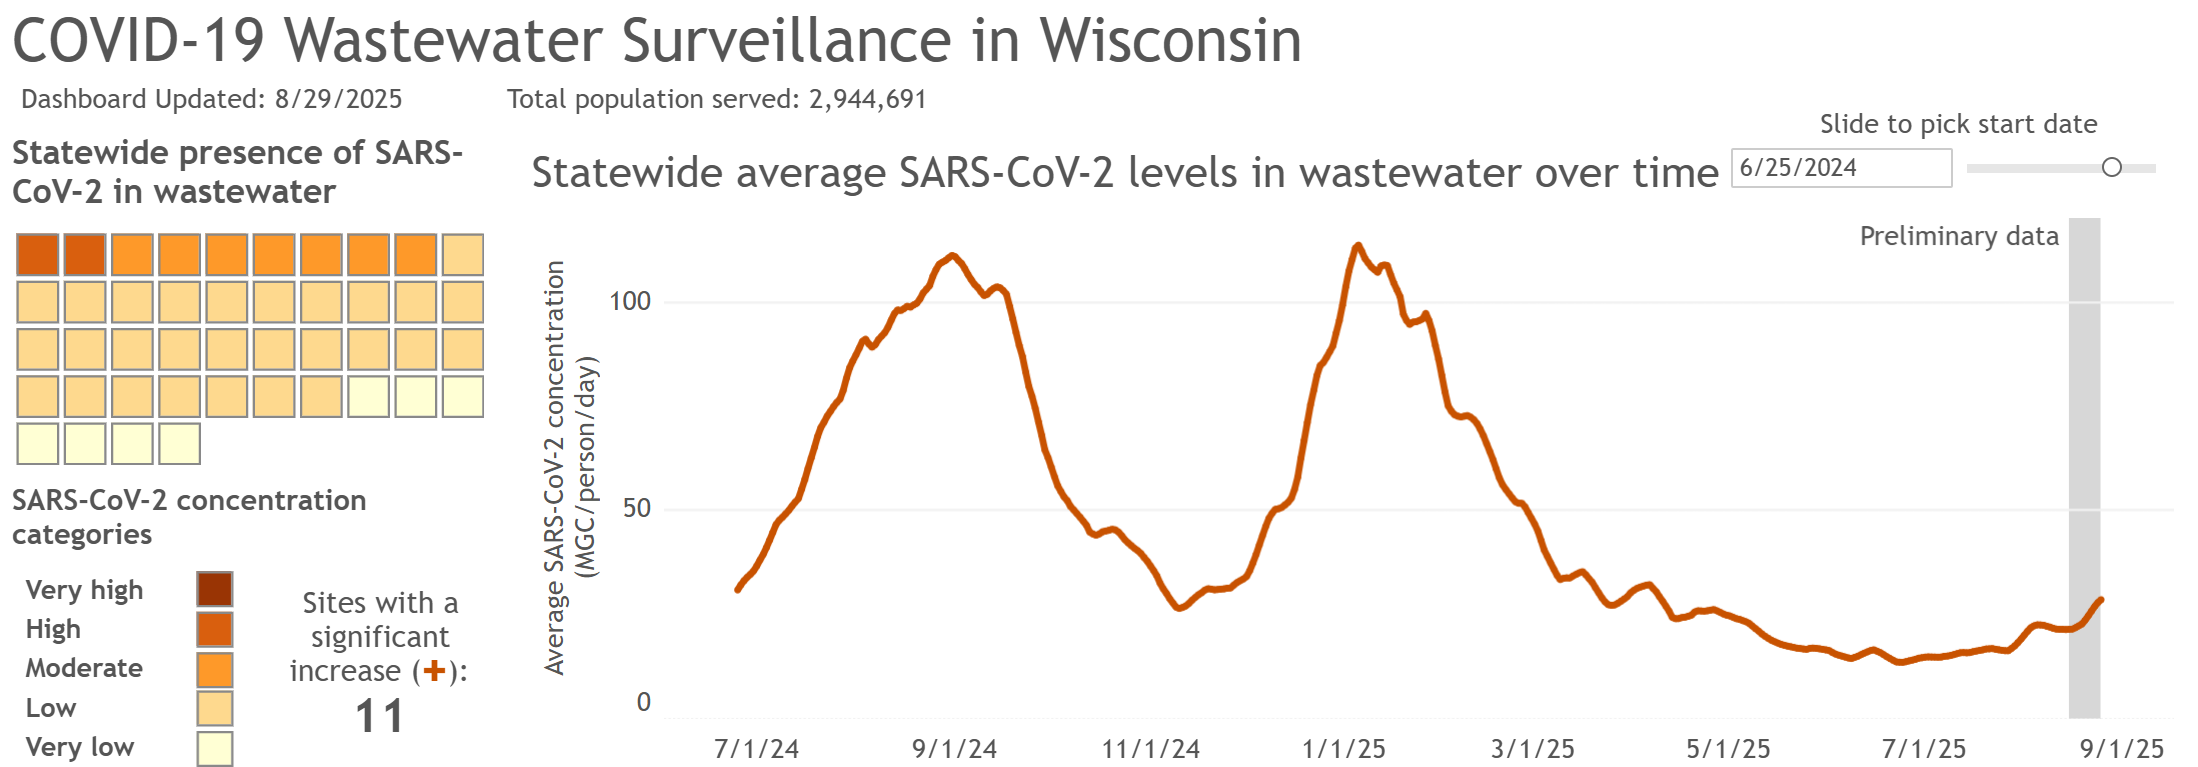
Just two days ago in my Wastewater Wednesday post, I noted that there were 7 sites with significant increases. Yesterday there were 12. Today there are still 11 (Madison's most recent data point lost its significant status for some reason - probably a recalculation, but we'll get to their graph in a bit.)
The eleven sewersheds currently showing significant increases are: Black River Falls, Fond du Lac, Hayward, Hudson, Milwaukee (Jones Island), Milwaukee (South Shore), Oshkosh, Racine, Spencer, Viroqua, and Waupaca.
The increases are steep and fast. Take a look at Hudson for instance:
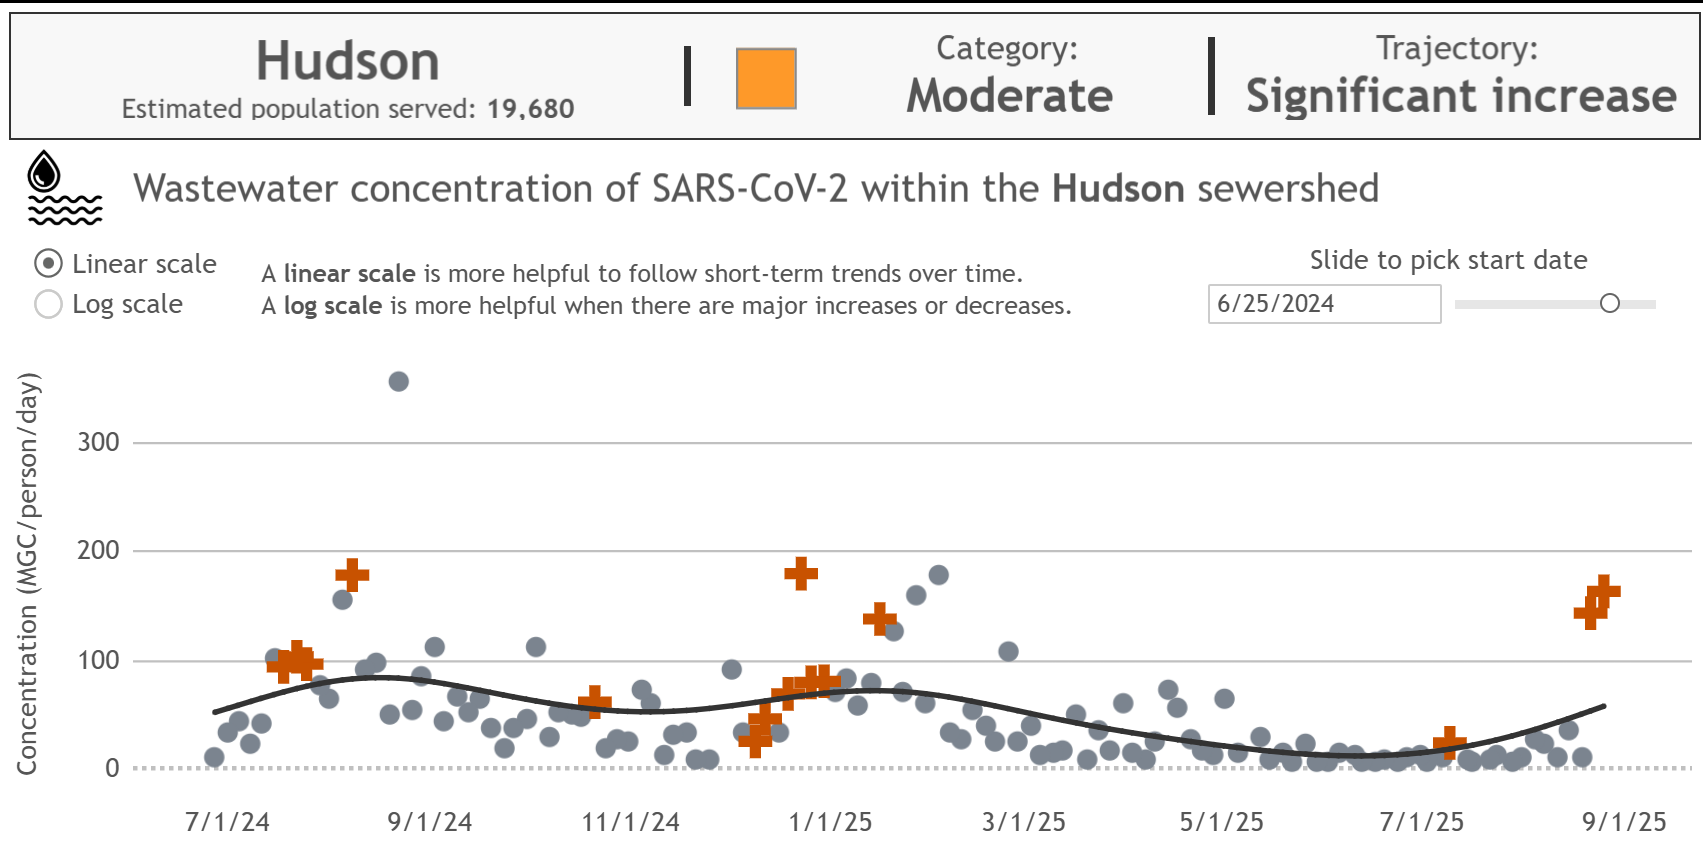
Those last two data points are near last winter's peak. Or take a look at Oshkosh. Similar pattern, though not quite as high as winter yet:
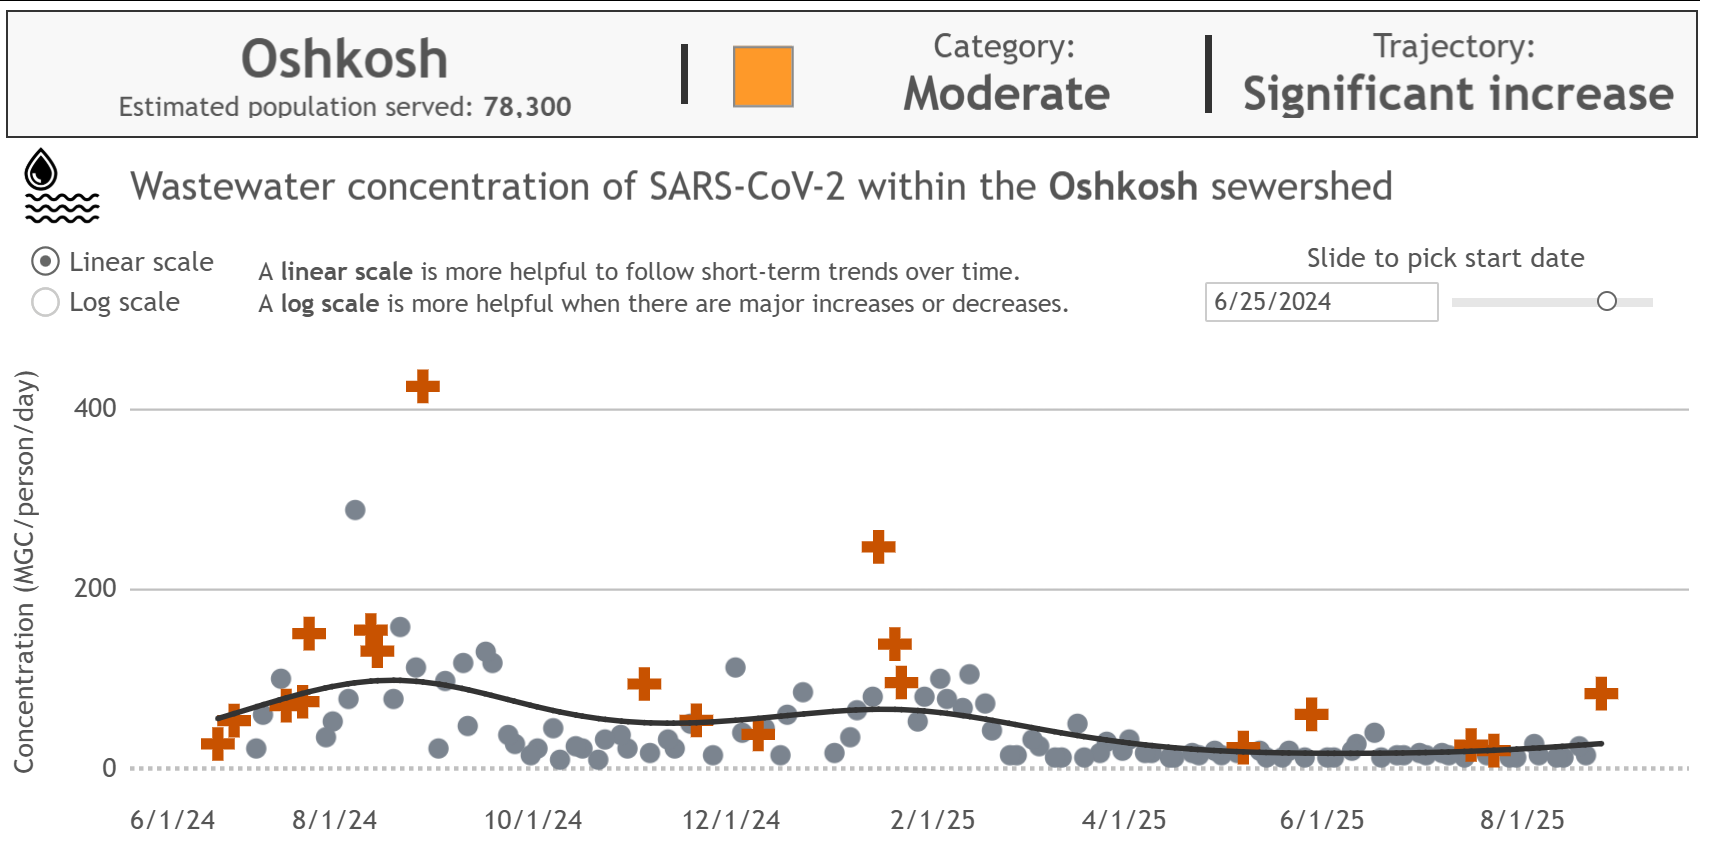
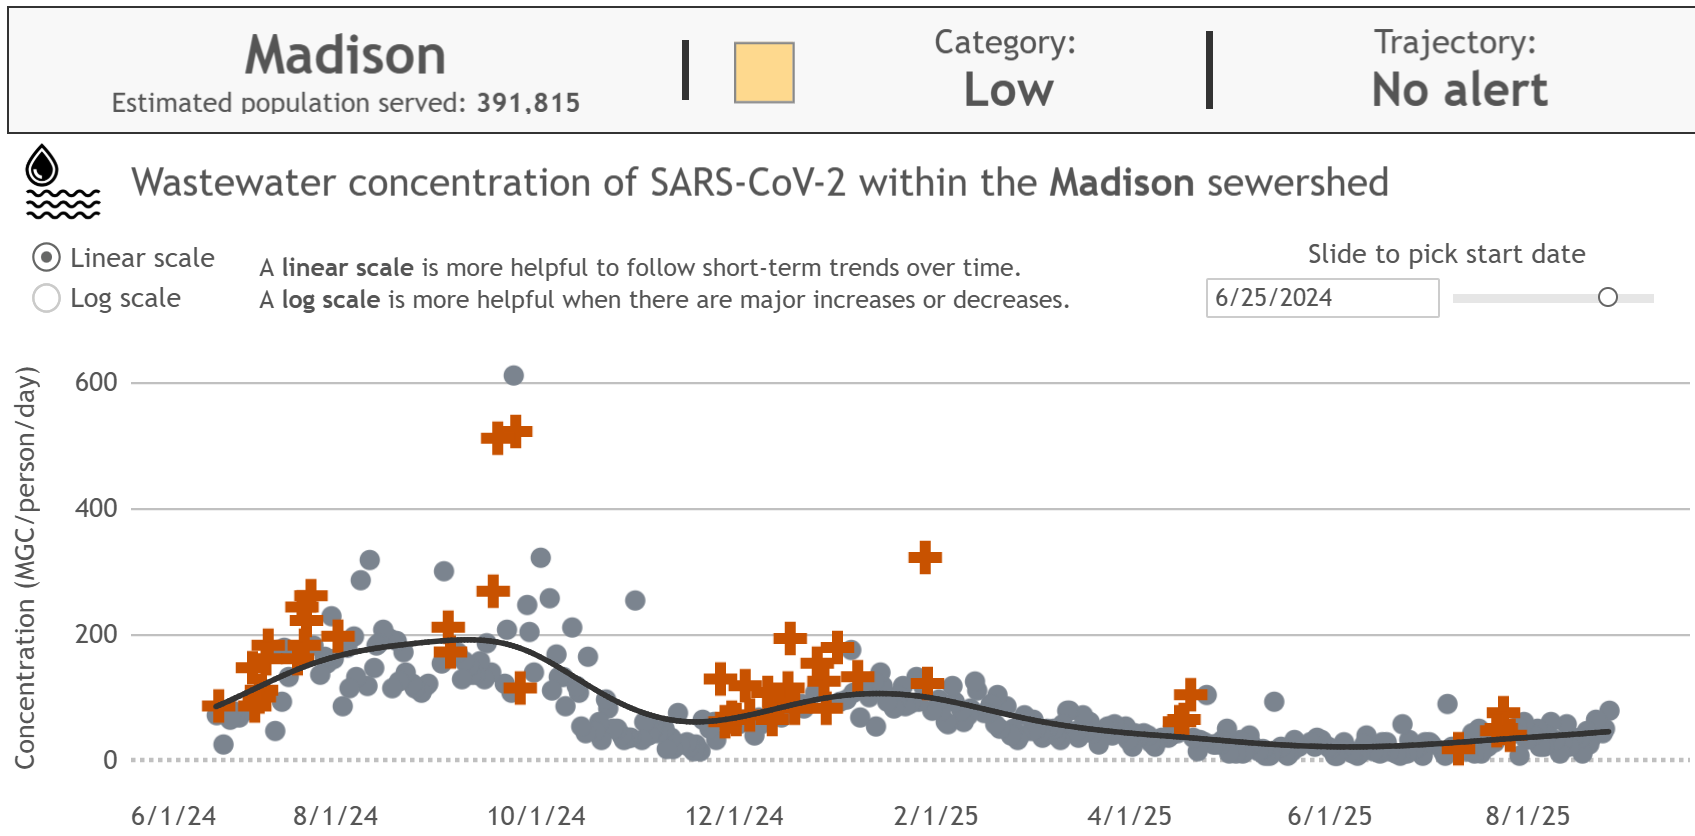
Returning now to Madison, that last data point on the graph was marked with an orange plus sign yesterday. Today it got changed back to an ordinary gray dot, but you can still see the trend. I expect that by next week we'll see Madison start to rise sharply as well:
What do we do?
We stop waiting for someone to save us.
We save ourselves and each other.
We mask up. We clean the air. We move events outside or open windows. We stay home when we're sick. We support our families, friends, and neighbors when they're sick. We take care of each other. We don't let the government divide us. We don't let the government kill us.
We keep us safe.
And we build a better tomorrow.